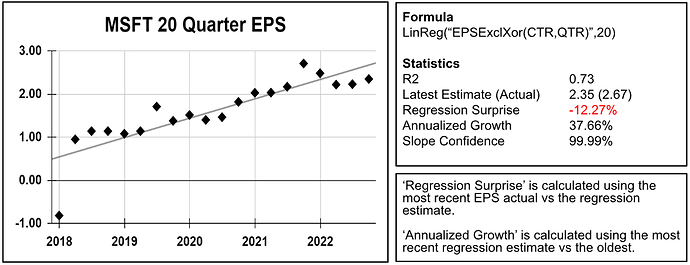
A complete set of regression functions and factors are available for screening and ranking. These are a great way to deal with outliers. Below is an example with Microsoft’s 20-quarter EPS regression. As you can see the growth rate of 37.66%, calculated using the regression, is not affected by the 2018 outlier.
Some of the things you can do with regressions include:
Find stocks that have a positive EPS slope (growth) with a good fit (low volatility).
Rank stocks based on their combined regression statistics: slope, R², and growth.
Find stocks where the latest EPS is above or below the regression estimate.
REGRESSION FUNCTIONS
Calculating regressions statistics is a two step process: first, the regression is calculated and stored (for performance reasons). Second, the regression statistics below can be used for analysis.
The following functions evaluate a regression:
LinReg(“Formula(CTR)”, iterations )
LinRegVals(y0,y1, …. y50)
LinRegXY(“X-Formula(CTR)”, “Y-Formula(CTR)”, iterations)
LinRegXYVals(x0, y0, …, x50, y50)The first two are time-series regressions where the X is not supplied and represents a period of time. The “XY” regressions are general regressions where the X is explicitly supplied.
The special "CTR" must be used in the formula for the functions with the iterations parameter. The formula will be evaluated using CTR from 0 to iterations-1. For example for 5 iterations, CTR will be 0,1,2,3,4.
REGRESSION STATS
The following statistics are available after you calculate a regression:
R2, SE, Slope, SlopeSE, SlopeTStat, SlopePVal, SlopeConf%, Samples, Intercept, InterceptSE
These statistics have a parameter
SurpriseY( offset )
EstimateY( offset )
EstimateXY( X )
RegGr% ( period = 1 )
Click here to open a spreadsheet example of all formulas and statistics
Examples
To use regression, you need to use a LinReg function, then you can use factors to access the statistics. Multiple regression are allowed using precise placement: regression factors access the most recent regression formula preceding the factor in a left to right, top to bottom order.
Time Series Regression
To find stocks where the 10Y sales regression has: 1) a positive slope 2) a good R2 of at least 0.8 and 3) latest sales above the trend, you could type the following
LinReg("Sales(CTR,ANN)",10)
R2 > 0.8 and Slope > 0 and SurpriseY(0) > 0
XY Regression
To find company where the latest EPS is above the expected EPS for a given revenue you could do the following:
LinRegXY("Sales(CTR,ANN)","EPSExclXor(CTR,ANN)",10)
SurpriseY(0) > 0
Ranking System Example
In a ranking formula you can use this one liner to rank using the slope of the past 60 prices. Eval is used to do the following: if the regression is successful the Slope is used for ranking otherwise NA.
Eval(LinReg("Close(CTR)",60), Slope, NA)PREBUILT SMOOTH FACTORS
For every fundamental line item you can find predefined regression factors for the most recent estimate and for the annualized regression growth. We predefine them for two periods: 5Y of TTM values sampled every 6 months and 10Y of Annual values. You will find these Smooth factors in the reference of each line time. For Example these are the Smooth factors for “Sales”
Prebuilt regression factors are available for any membership.
Factor | Equivalent to |
|---|---|
SalesRegEstTTM | Eval(LinReg(“Sales(CTR * 2, TTM)”, 10), EstimateY(0), NA) |
SalesRegGr%TTM | Eval(LinReg(“Sales(CTR * 2, TTM)”, 10), RegGr%(2), NA) |
SalesRegEstANN | Eval(LinReg(“Sales(CTR, ANN)”, 10), EstimateY(0), NA) |
SalesRegGr%ANN | Eval(LinReg(“Sales(CTR, ANN)”, 10), RegGr%(1), NA) |