
A brief introduction video on how to use our Stock Pages by Yuval Taylor:
Timeline
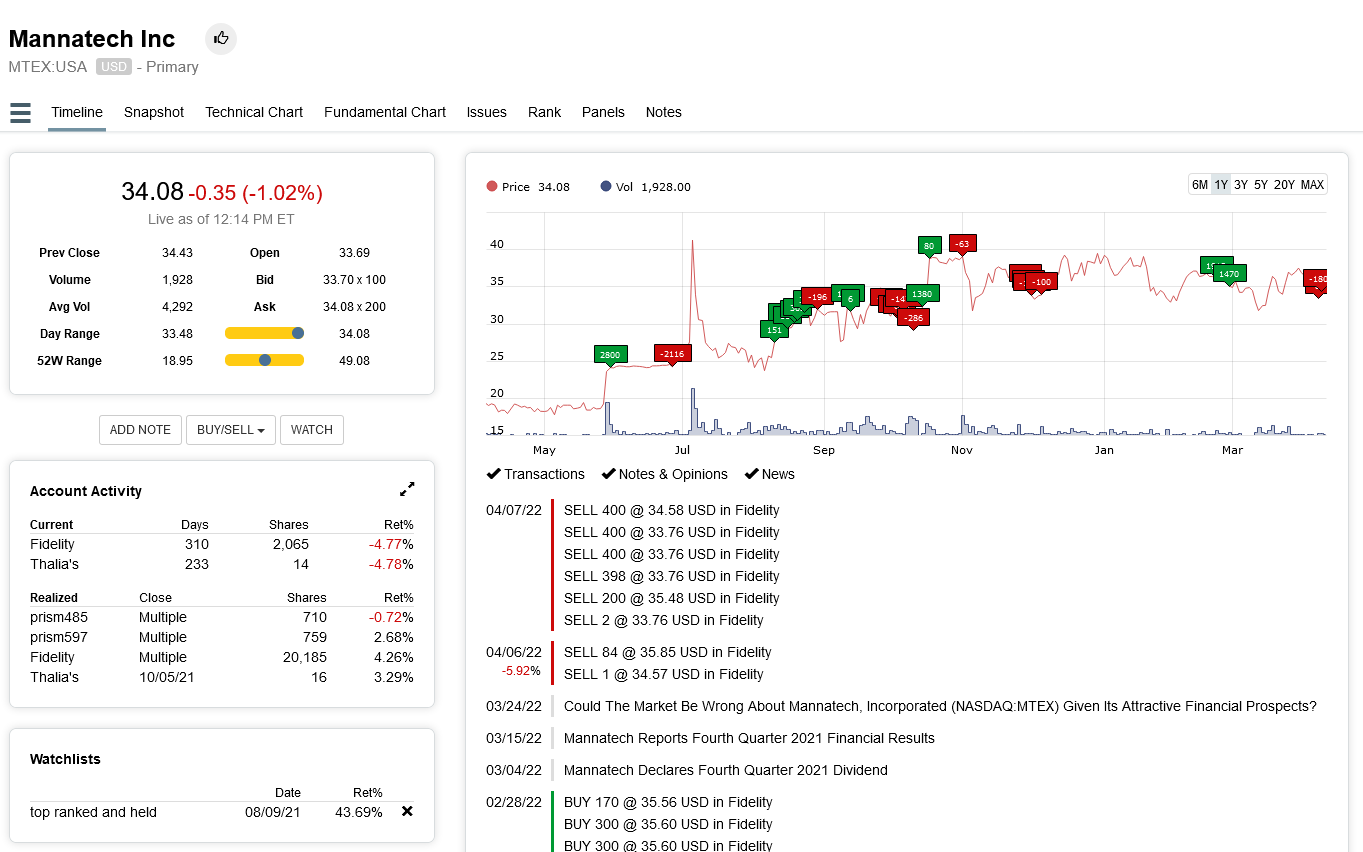
This page shows all your activity, including transactions, notes, and opinions. You can also quickly see if you have positions in the stock or if it’s in a watchlist, and see the latest news. The Stock Timeline is your personal dashboard for every single stock.
SnapShot
Here you’ll find all the essential information about every stock, including ratios, estimate revisions, share count changes, pricing data, growth rates, and charts of historical financial trends.

Panels
Research subscribers can create their own pages to view the information they want for each stock, choosing from over 75 different panels. You can link to a company’s SEC filings; chart its growth; get at-a-glance figures from the company’s last eight-years’ statements; watch its estimate trends; examine its financial ratios over the last decade; compare its metrics to its industry’s, sector’s, and the market’s median; and much, much more.
