Link to AI Factor Model: https://www.portfolio123.com/sv/aiFactor/23341/overview
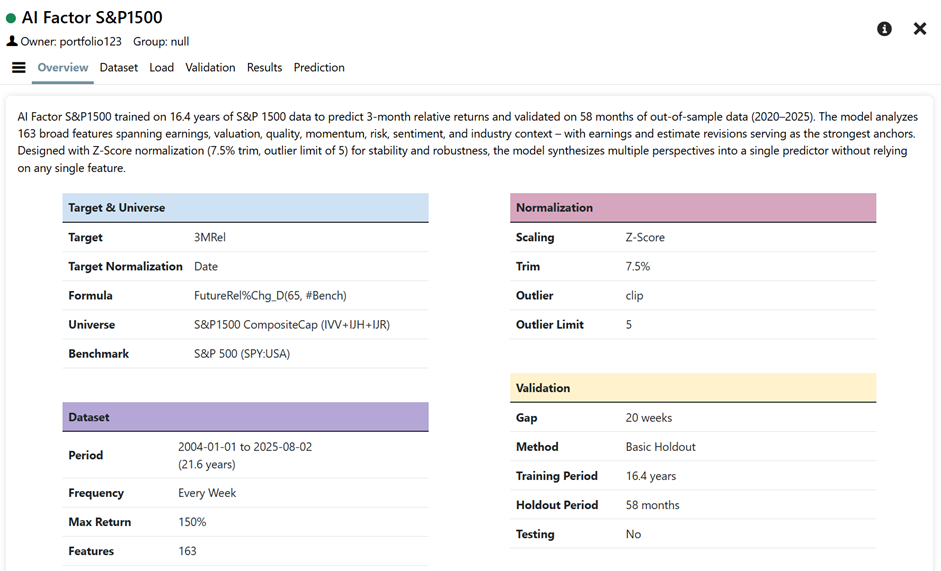
The AI Factor S&P500 model is configured to predict 3-month relative returns for stocks in the S&P 500 universe, using the S&P 500 as its benchmark. The target formula looks forward 65 trading days to calculate each stock's percentage return relative to the benchmark.
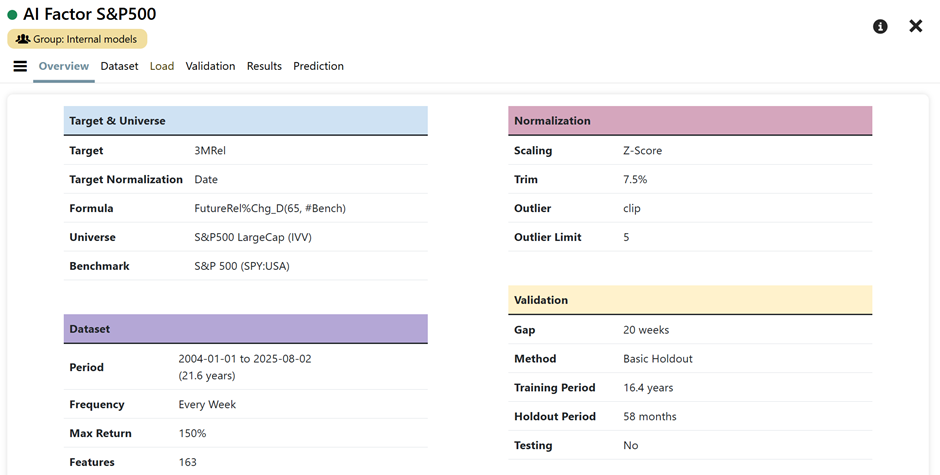
The dataset covers over 21 years of weekly data, from January 2004 to August 2025, giving the model a rich history across multiple market regimes.
For normalization, the model uses Z-Score + Date with a 7.5% trim and an outlier limit of ±5.
Validation
The validation setup follows a basic holdout structure.
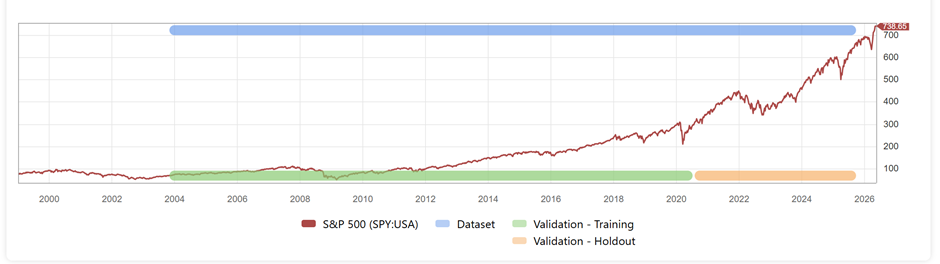
The model is trained on 16.4 years of data, ending around mid-2020, followed by a 58-month holdout period from 2020 through 2025. The model has not seen the post-2020 data during training — performance observed during the holdout period represents an out-of-sample validation.
Feature Set Overview
A total of 163 features are used as inputs.
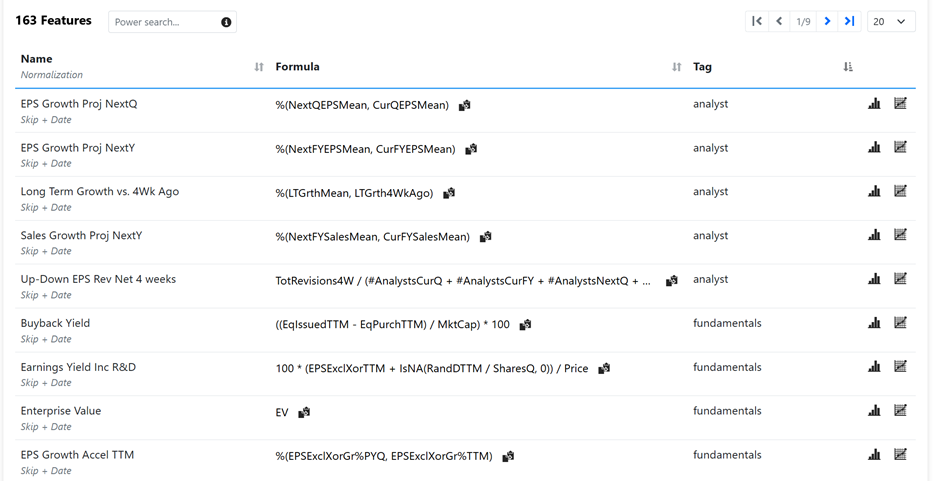
On Redundancy
The AI Factor S&P500 model is built on 163 features spanning fundamental, technical, estimate, and aggregated data. Rather than a curated, minimally redundant set, the feature list is deliberately broad and overlapping. This is intentional — tree-based ensembles like ExtraTrees benefit from redundancy because they sample features randomly at each split. Having multiple-correlated signals gives the model more "good options" for early splits, which increases stability across market regimes.
All features share the same two-step normalization: first Skip (meaning no initial transformation is applied at the feature level — raw values are passed through), then Date normalization, which standardizes cross-sectionally at each point in time.
Earnings Data
Earnings Data includes standard EPS growth metrics across three-year, trailing twelve-month, and prior-year-quarter horizons, plus acceleration measures that compare short-term growth to longer-term growth. Analyst estimates are heavily represented — current quarter and current fiscal year EPS means, plus their 1-week, 4-week, 8-week, and 13-week lags, allowing the model to detect revision momentum. Next-quarter and next-fiscal-year estimates extend the forward-looking view. Estimate variability and standard deviations help the model gauge analyst conviction. Earnings surprises from recent quarters appear both individually and in a weighted composite that gives more importance to the most recent reports. Recommendation changes and long-term growth estimate trends round out the analyst sentiment bucket.
Valuation
Valuation features are diverse: Traditional metrics like trailing P/E, price to book, price to tangible book, price to cash flow, and price to free cash flow sit alongside enterprise value-based measures such as EBITDA to EV, gross profit to EV, and unlevered free cash flow to EV. Forward-looking valuation appears through forward earnings yield and forward revenue yield. The model also includes earnings yield adjusted for R&D spending, effectively treating R&D as a capital investment rather than an expense.
Quality & Profitability
Quality is measured from multiple angles: Operating margin levels (TTM and 5-year average), return on investment, return on assets, and median return on equity provide profitability snapshots. Changes in these metrics — like quarterly changes in gross margin, debt to assets, current ratio, asset turnover, and ROA — capture improving or deteriorating fundamentals. The model also tracks non-recurring items as a percentage of sales to reward clean income statements and uses a consistency measure counting how many of the last six quarters showed year-over-year EPS growth.
Momentum & Price Trends
Price momentum is measured across multiple timeframes: 3-month, 6-month, and 9-month returns (using overlapping periods), plus proximity to 52-week highs and lows. A feature called "velocity" compares a stock's simple moving average from one month ago to its average from one year ago, normalized by average true range — a smoothed momentum measure that ignores the most recent month to avoid chasing sharp moves. Industry-relative price strength appears for 26-week and 52-week horizons. The model also includes short-term price changes (4-week returns) to capture recent drift.
Volatility & Risk
Risk is captured through beta at 1-year, 3-year, and 5-year horizons. Price volatility appears as standard deviation over 60 days, 12 months, 3 years, and 5 years. Share turnover — both 3-month and 1-year averages — acts as a liquidity proxy and beta predictor. Sortino ratios over 1- and 2-years measure risk-adjusted returns with a focus on downside volatility.
Technical & Flow
Money flow and accumulation signals are well represented. Chaikin Money Flow persistency, Chaikin Accumulation/Distribution, and a Chaikin Trend indicator help the model detect whether institutional money is moving into or out of a stock. Volume trends appear as 1-week versus 1-month volume and 1-month versus 6-month volume. Up-down ratios over 20, 60, and 120 trading days provide additional flow-of-funds perspective. Simple moving average crossovers (20-day EMA divided by 120-day EMA) add a trend-following element.
Industry Context
The model does not look at stocks in isolation. Industry-level aggregates appear throughout: industry RSI, industry EPS growth TTM, industry FCF growth, industry earnings yield, and industry momentum over 1-month, 3-month, 6-month, and 1-year horizons. Subindustry momentum provides an even more granular peer comparison. A feature comparing a company's gross plant to sales ratio against its industry median helps identify companies with asset structures that look out of line with peers.
Capital Allocation & Growth
Buyback yield, shareholder yield (dividends plus buybacks), and inventory changes indicate how management is deploying capital. Three-year sales compound growth, TTM sales growth, and prior-year-quarter sales growth capture revenue expansion. Book value growth over five years adds a longer-term perspective. Free cash flow growth and free cash flow as a percentage of assets provide additional fundamental momentum signals.
Composite & Engineered Features
Several features combine multiple dimensions into single signals. A triple-factor momentum score integrates price, cash flow, and volatility. A PEG ratio variant compares free cash flow growth to valuation. A feature rewarding PEG ratios near 1 punishes both extremes as unsustainable. Another feature multiplies institutional flow by relative momentum to identify where smart money aligns with price strength.
Hyperparameter Sensitivity
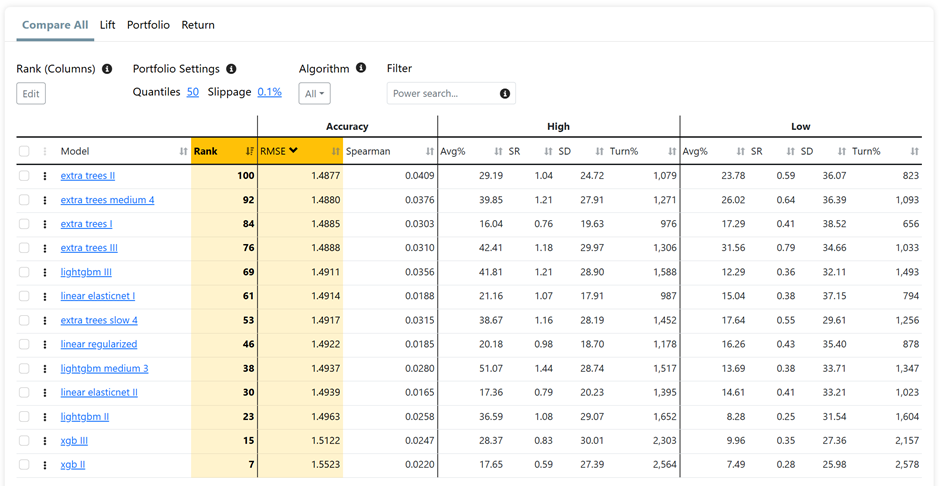
The model was tested across 13 different configurations — including multiple variants of ExtraTrees, LightGBM, XGBoost, and linear models — all trained on the same 163‑feature dataset with the same target.
Despite wide variation in hyperparameters, the predictive accuracy remains stable. This low hyperparameter sensitivity points to robustness.
Predictor
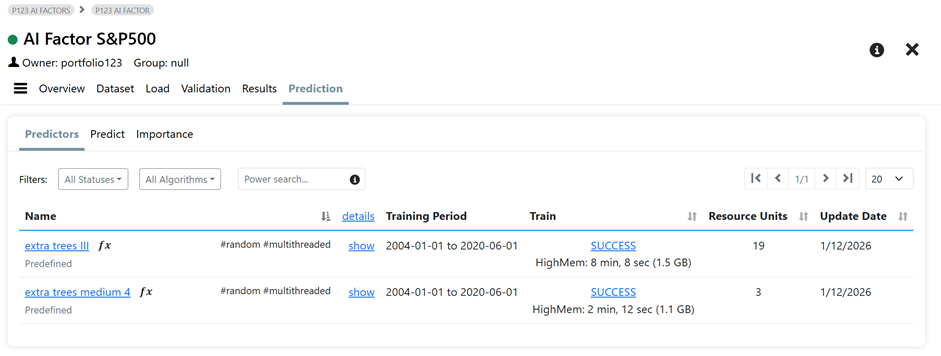
The Predictors are trained from 2004-01-01 to 2020-06-01 (which matches the training period) to preserve a long, untouched holdout period.
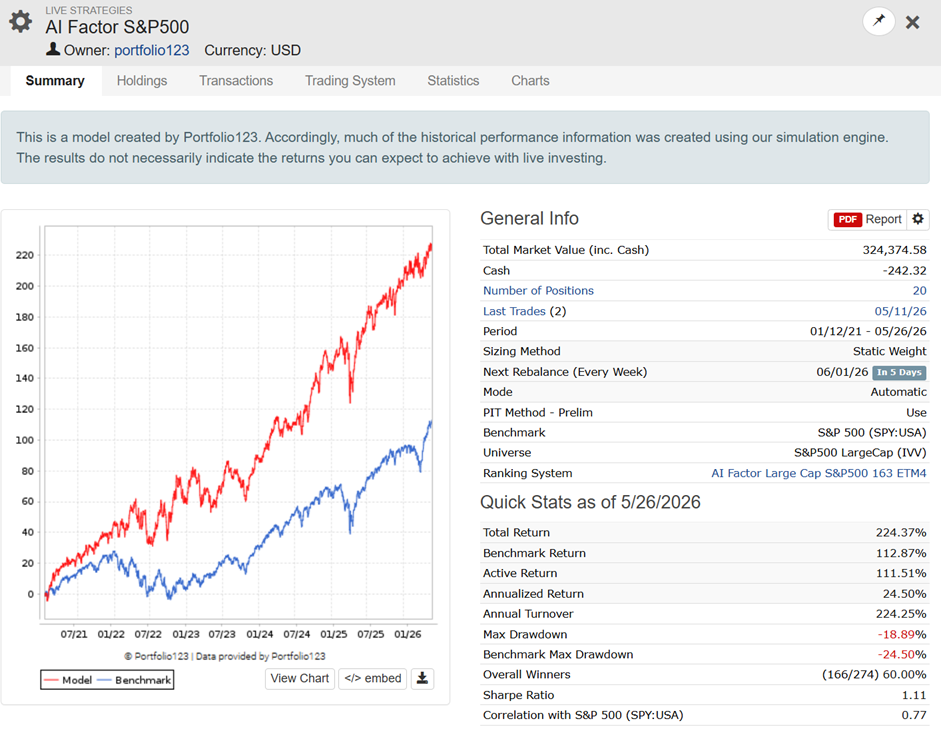
The above predictor is used in the ranking system of the following (public!) Portfolio Strategy: https://www.portfolio123.com/port_summary.jsp?portid=1909114
Performance from 2021 through 2025 is based on a simulation using AI Factor predictions. The model has been live since January 20, 2026.
Predictor Lifecycle & Annual Review
The predictor is retrained once per year using the same disciplined methodology: a fixed training window ending June 2020 + 1 Year (or the equivalent representative period), the same 163-feature set, and identical hyperparameters.
But retraining does not mean automatic replacement. Each year, the newly trained predictor is evaluated against the existing one. The bar is not "different" – it is better.
Performance is compared across multiple dimensions:
- Out-of-sample pseudo performance
- Stability across regimes
- Alignment with the existing equity curve
Only if the new predictor demonstrates clear and measurable improvement over the full 5‑year holdout period does it replace the existing version. If performance is comparable or worse, the current predictor remains in place.
This ensures that the model evolves only when it genuinely benefits from additional data – not for the sake of change. The result is a predictor that improves over time without introducing unnecessary instability or chasing short-term noise.
Discussion of Design Choices
Obviously, there are other successful approaches to building AI Factor predictors — different validation methods, predictor lifecycle, different feature combinations, training on more recent data, and so on. The model shown here is just one example.
Paper on Design Choices
If you want to explore alternative design choices in more depth, this paper from Hanauer et al is a good starting point:
"Design Choices, Machine Learning, and the Cross‑Section of Stock Returns"
https://papers.ssrn.com/sol3/papers.cfm?abstract_id=5031755
Hanauer's key insights for P123 users:
Target → Use market‑relative returns for example 3MRel (Rel%Chg_D(65, #Bench)) for non‑linear models (like ExtraTrees, LightGBM, XGB)
Target transformation → Keep returns continuous (High Max Return).
Training window → Training on long, uninterrupted data (expanding windows) significantly outperforms short rolling windows that discard old data.
Features → Add novel signals (actuals, revisions, volume). Published factors alone underperform.
Feature selection → Do not obsess over pruning. Trees handle redundancy.
Non‑linear edge → ExtraTrees / LightGBM / XGB beat linear models only with the right target + continuous returns + long training.
Validation → Keep holdout truly unseen (basic holdout or multiple cutoffs).
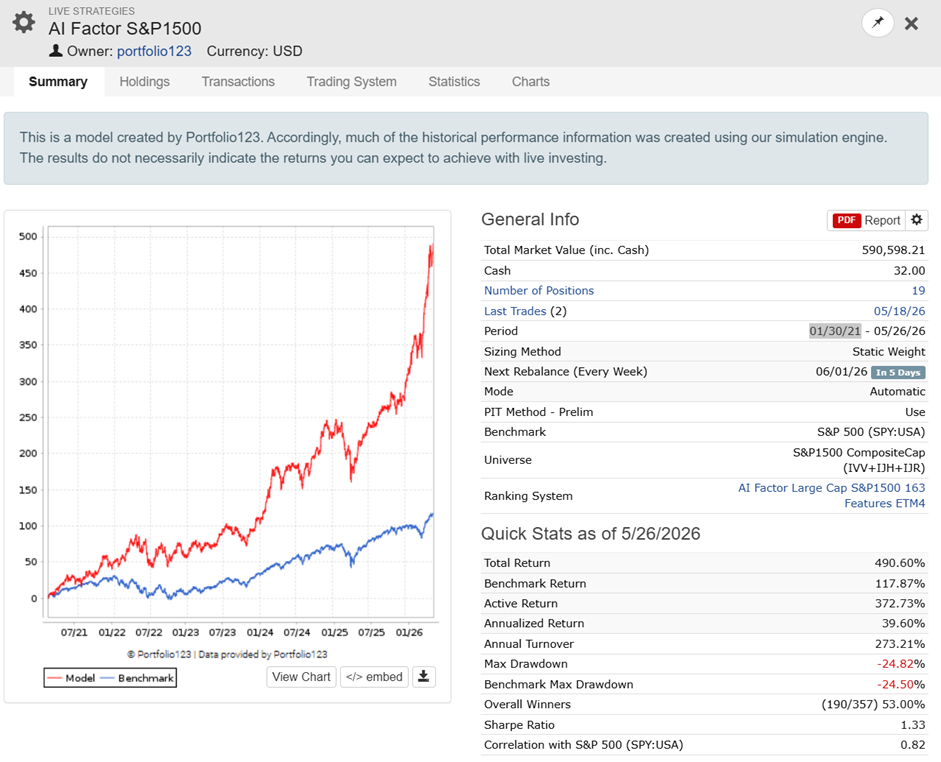
AI Factor S&P1500
We implemented the above discussed AI Factor Model 1:1 to the SP1500 Universe: https://www.portfolio123.com/sv/aiFactor/24355/overview
Corresponding Portfolio Strategy:
https://www.portfolio123.com/port_summary.jsp?portid=1913454