Tool to analyze datasets and identify high-alpha factors
FactorMiner
Introduction
Portfolio123 offers a vast library of factors and formula variations, making it possible to build powerful strategies — but manually selecting the right factors is time-consuming. FactorMiner solves this by automating univariate (single) factor performance analysis.
FactorMiner estimates benchmark Alpha and Beta, tail-weighted information coefficient (IC), t-statistics, factor correlations, and high/low quantile returns. Based on your ranking and threshold settings, FactorMiner produces a refined "best factors" list ready for use in Portfolio123 Ranking Systems, Screens, AIFactor, or your own external research workflows.
Step 1: Create a Dataset
FactorMiner runs on datasets generated through Portfolio123's Factor List feature. You must create a dataset there before launching any analysis.
Create a Factor List
From the main menu, go to Research → Tools → Download Factors.
Click New Factor List, enter a name, and click Submit.
Build your factor list by adding predefined factors, entering formulas manually, or importing from an existing Ranking System, AIFactor, Factor List, file, or clipboard.
Generate the Dataset
Go to the Generate tab and configure your settings. Keep the following in mind:
Generation Format must be set to Parquet — FactorMiner requires this.
Set N/A Handling to None if you want missing value counts included in results.
The Frequency you select determines both the data sampling interval and the look-forward period used to calculate future returns.
Large universes, long date ranges, short frequencies, and many factors will increase dataset size and API Credit usage. See this page for information regarding API Credits.
Click Generate. When complete, you'll see a "Dataset is ready and available" message.
WARNING: Avoid factors with complete NA coverage If any factor in your dataset has missing values (NA) for every ticker on any given date, FactorMiner will skip all dates up to and including that date. This can significantly shorten your effective analysis period. While creating your Factor List, review your factors and remove any that have 100% NA coverage on one or more dates.
Examples of factors that are NA for all stocks:
Insider & Institutional Ownership: All dates for Europe & Canada. Before mid-2004 for US.
Short Interest: All dates for Europe & Canada.
Actuals: EPS/Sales before 2005 and EBITDA before 2008.
SalesSurp%: Before 2003
EPS Revisions: All dates for Europe.
PriceTarget: Before mid 2001
Launch FactorMiner
Go to the Analyze tab and click Launch to open FactorMiner.
Note: You do not need to click the Download button — that exports data for external use only.
Step 2: Configure Your Analysis
Sidebar
The sidebar lets you select a dataset, access previous analyses, or start fresh. If this is your first time, click New Analysis.
Dataset Section
This section displays key information about your dataset: period, frequency, universe, benchmark, and other settings.
Click Formulas to see the full factor list with underlying formulas and tags.
Click Preview to view a sample of the dataset.
A few things to know:
Future return look-forward periods are added automatically during Parquet generation and always match the rebalance frequency.
Transaction prices in FactorMiner are based on the next close.
Portfolio Settings
Configure how FactorMiner constructs portfolios and ranks factors:
Parameter | Default | Description |
|---|---|---|
Rank By | Alpha | Metric used to rank factors: Annualized Alpha or IC |
Factor Sorting | Auto-detect ON | Auto-assigns sort direction per factor based on IC analysis (IC > 0). Disable to set directions manually (not recommended). |
High Quantile (%) | 10.0 | Top-ranked stocks in the H portfolio. Set to 0 to use short-only logic. |
Low Quantile (%) | 10.0 | Bottom-ranked stocks in the L portfolio. Set to 0 to use long-only logic. |
Max. Return % | 200 | Excludes any stock with a return exceeding this value on a given date. |
Tip: Setting a deliberate "wrong" sort direction can be useful for research (e.g., estimating the impact of buying low-quality stocks while shorting high-quality ones). Factors with negative IC will be deprioritized in "best factor" selection, but you can still view their full results in the All Factors tab.
Analysis Filters
These filters determine which factors qualify for the final "best factors" list:
Parameter | Default | Description |
|---|---|---|
Min. Annual Alpha | 0.50 | Minimum Alpha required for selection. For Low-only portfolios, acts as a maximum threshold. |
Min. IC | 0.01 | Minimum information coefficient required for selection. |
Max. Factors | 10.0 | Maximum number of factors in the final list. |
Max. NA (%) | 40.0 | Maximum percentage of missing data points allowed across the dataset. |
Correlation Threshold | 0.50 | Maximum allowed correlation between selected factors to ensure diversification. |
Tip: To effectively disable any filter, use an extreme value — for example: Min. Alpha = -1000, Min. IC = 0, Max. Factors = 1000, Max. NA (%) = 100, Correlation Threshold = 1.0.
Use Last Settings
Click Use Last Settings to restore the configuration from your most recent analysis. Running a new analysis will overwrite those saved settings.
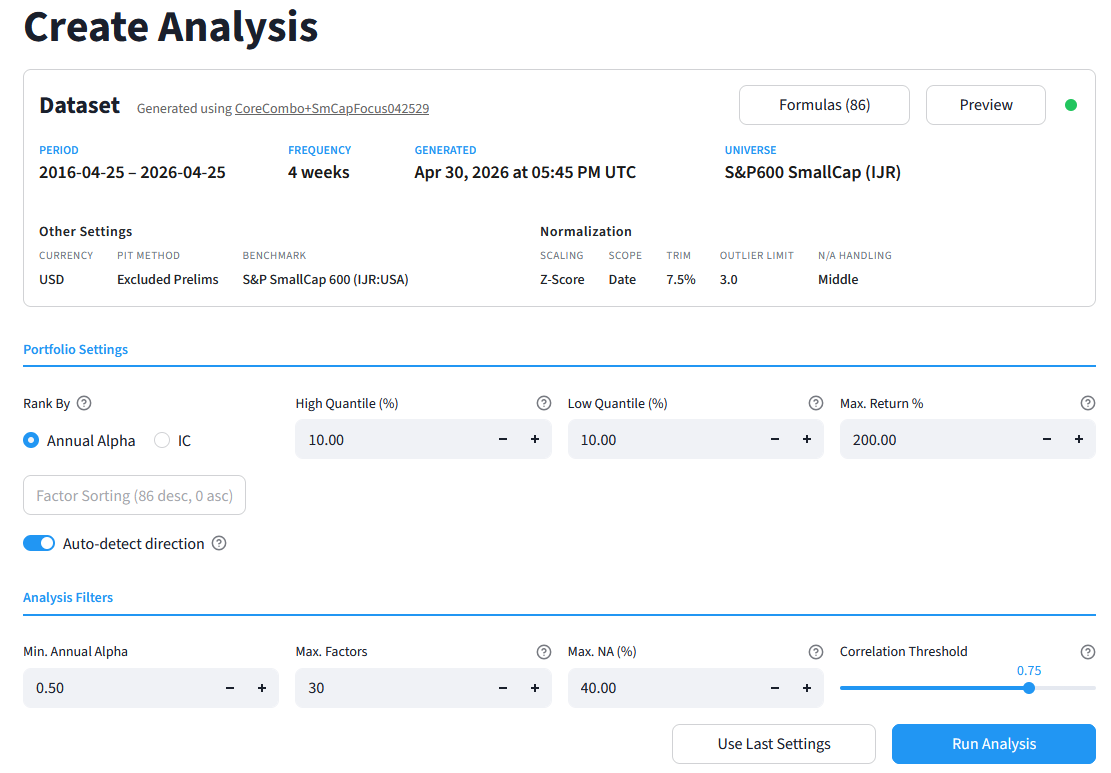
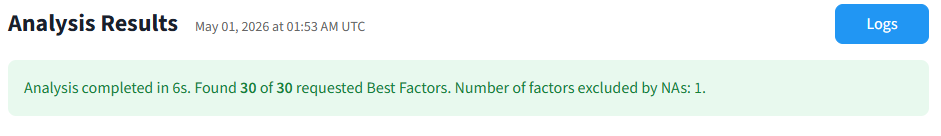
Step 3: Run the Analysis
Once your settings are configured, click Run Analysis. A progress bar will track the computation. When complete, the Analysis Results page opens with a summary of how many factors passed your filters.
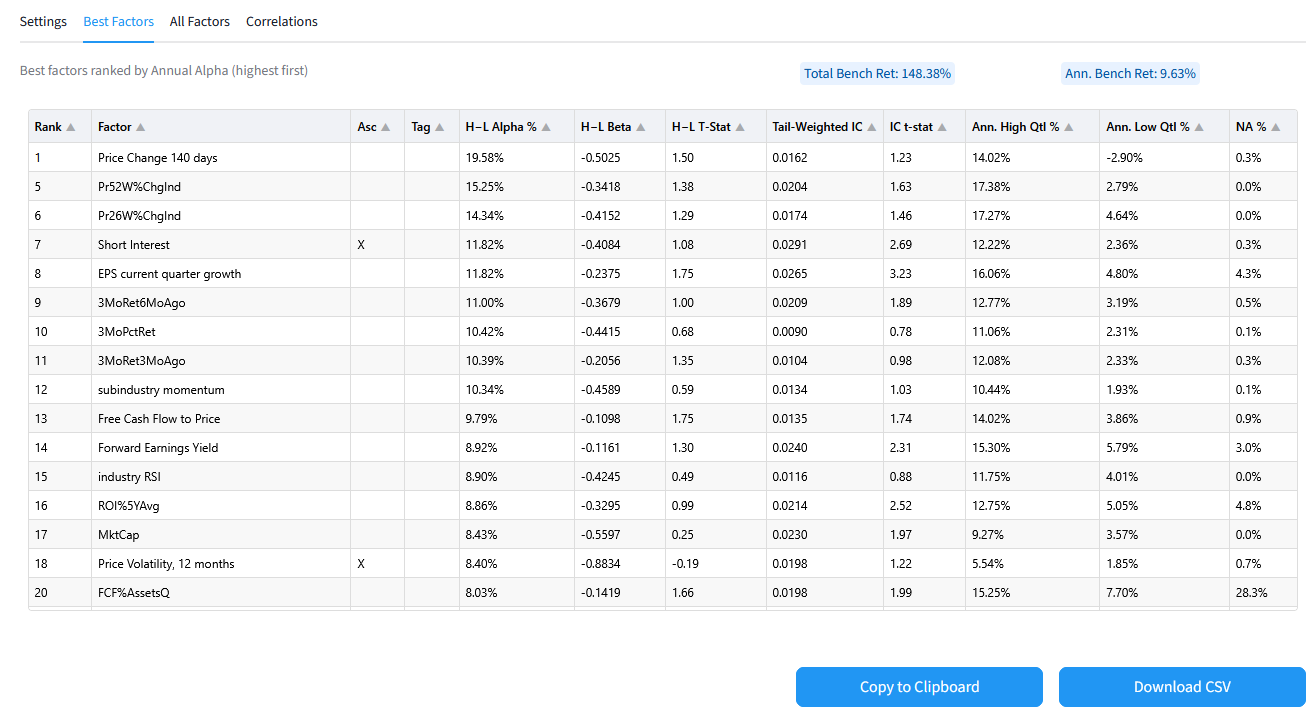
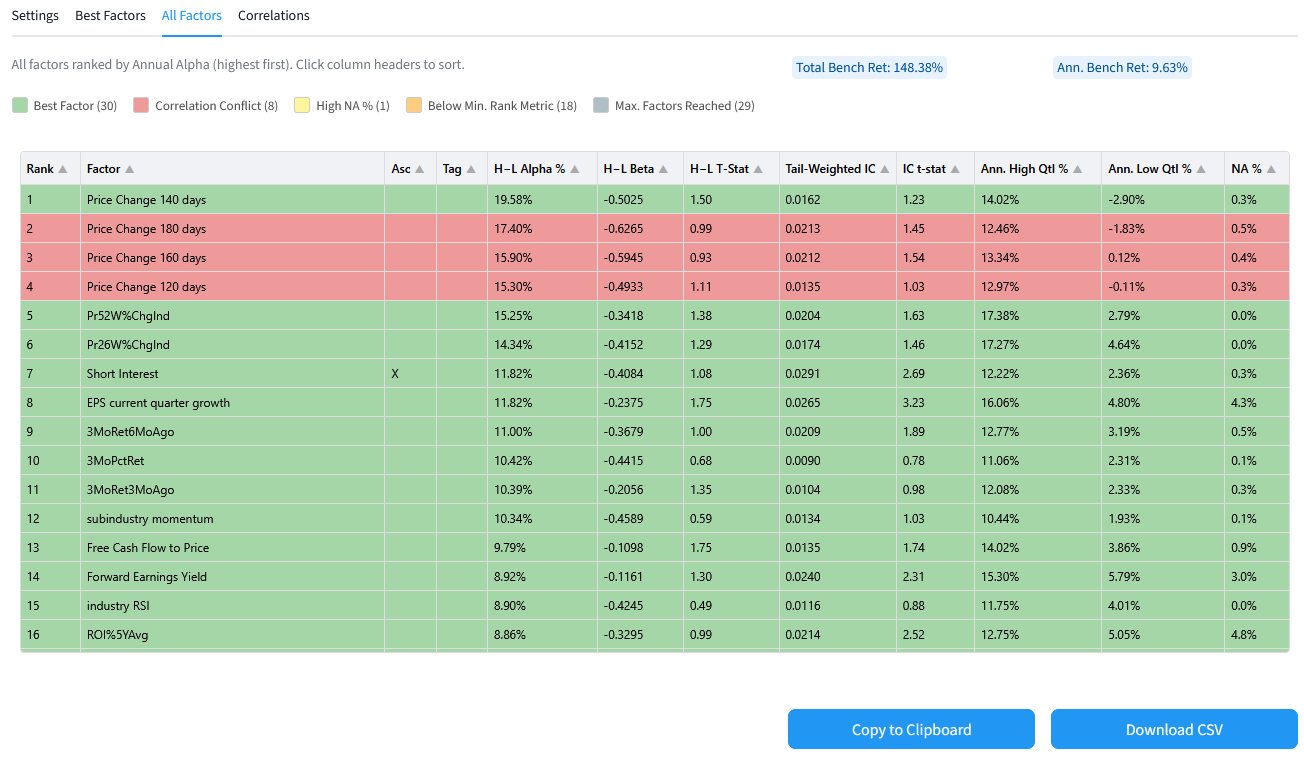
Step 4: Review Results
Results are organized into three tabs:
Best Factors — Factors with the highest (or lowest) annualized alpha or highest IC that satisfy all active filters.
All Factors — The complete ranked factor list, color-coded to indicate filter violations.
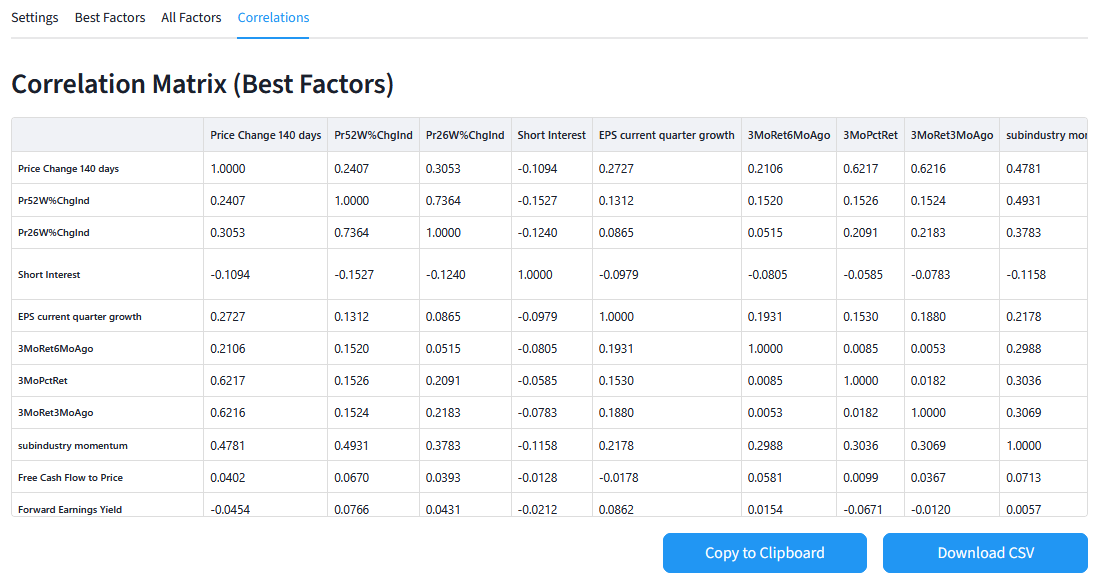
Correlation Matrix — The correlation matrix for your best factors, plus a list of pairwise conflicts that caused exclusions.
Best Factors
All Factors
Correlations
Methodology Notes
Alpha & Beta Calculation Calculated and ranked based on your chosen portfolio construction method. Higher Alphas are preferred for H-only and H-L portfolios; lower Alphas are preferred for L-only portfolios.
H-L Portfolio Logic Assumes equal weighting of long positions in the H quantile and short positions in the L quantile, held until the next rebalancing date (as determined by dataset frequency)..
L-only Portfolio Logic Statistics are calculated using long-only logic (buying the low quantile), even though lower Alphas are preferred.
Alpha & Beta — Important Caveat Regressions for Alpha and Beta estimation do not currently correct for the risk-free rate. As a result, absolute values are slightly overstated.
Tail-Weighted IC IC is calculated as the weighted correlation between factor ranks and ranked future performance across all tickers per date, averaged across all dates. The weighting formula w = 1 + 4 × (0.5 - f) — where f is the factor rank between 0 and 1 — gives greater weight to extreme factor ranks in the final IC output.
Replication Differences Results from FactorMiner will show slight deviations when replicated in a Screen Backtest or Ranking System Backtest, due to minor differences in portfolio construction (NA handling, max return handling, bucket and date cutoffs, etc.).
FactorMiner is a pre-analysis tool. Always validate results in full trading simulations that account for slippage, fees, transaction prices, liquidity, and factor interactions before acting on them.
Further Processing
Every result table can be downloaded as a CSV or copied to the clipboard. For example, you can download the Best Factors CSV, extract the Formula and Name columns, and import them into the Features tab in AIFactor.