Introduction
This guide will walk you through creating and evaluating Machine Learning (ML) models using financial data. You'll discover how to build a viable dataset for the training, starting from a set of features, data preprocessing, and target variables to build a reliable prediction model, also known as an "AI Factor." We'll also show you how to assess your AI Factor using charts and performance metrics. Finally, you'll learn to apply AI Factors to new datasets and incorporate them into backtests and ranking systems to enhance your investment strategies.
Table of Contents
Getting Started with AI Factors
Preparing Your Dataset
Training and Validation
Evaluating Your AI Factor
Creating and using Predictors
Conclusion
1. Getting Started with AI Factors
Once you create a new AI Factor, select a target variable, the factor you want to predict (for example, excess return over the benchmark over the next three months). Also, you choose a training universe to use as the base of the factor dataset. Next, set your universe's benchmark, currency, and additional filtering rules.

2. Preparing Your Dataset for training
Preprocessing
Data preprocessing of your dataset is necessary for the training. This process involves handling outliers, missing values, and scaling or transforming variables.

Scaling: Scaling is transforming features to have a similar range or distribution. This is important because ML algorithms are sensitive to the scale of input features, and features with larger scales can disproportionately influence the model's predictions. Common scaling techniques include:
Rank: Values are sorted in descending order, then assigned the percentile rank from 1 to -1. The percentile step is calculated excluding NAs. This transformation maintains the relative order of the original data points and is particularly effective for handling non-linear relationships or non-normal distributions.
Z-Score: Scale the features to have a mean of 0 and a standard deviation of 1 by subtracting the mean and dividing by the standard deviation.
N/A Handling: Missing values, often represented as NAs (Not Available), can be common in financial datasets for various reasons, such as data unavailability or reporting inconsistencies. Handling missing values is crucial, as most ML algorithms cannot process datasets with missing values. We replace missing values with the median of the distribution.
Trim %: How much of the data is trimmed from each side. The distribution statistics are calculated omitting trimmed values. Values, including those trimmed, are normalized using those statistics, the result of which may further be constrained by outlier settings. Typically a 7.5% im works well with financial data, for a total of 15% of the data being omitted when computed distribution statistics.
Outlier Limit: Outliers are data points that significantly deviate from most other data points in the dataset. They can hurt the performance of ML models, as they may cause the model to overfit or produce biased predictions. The trimmed outliers are substituted with either +/- the "Outlier Limit" depending on whether they are on the left or right of the mean.
Dataset selection
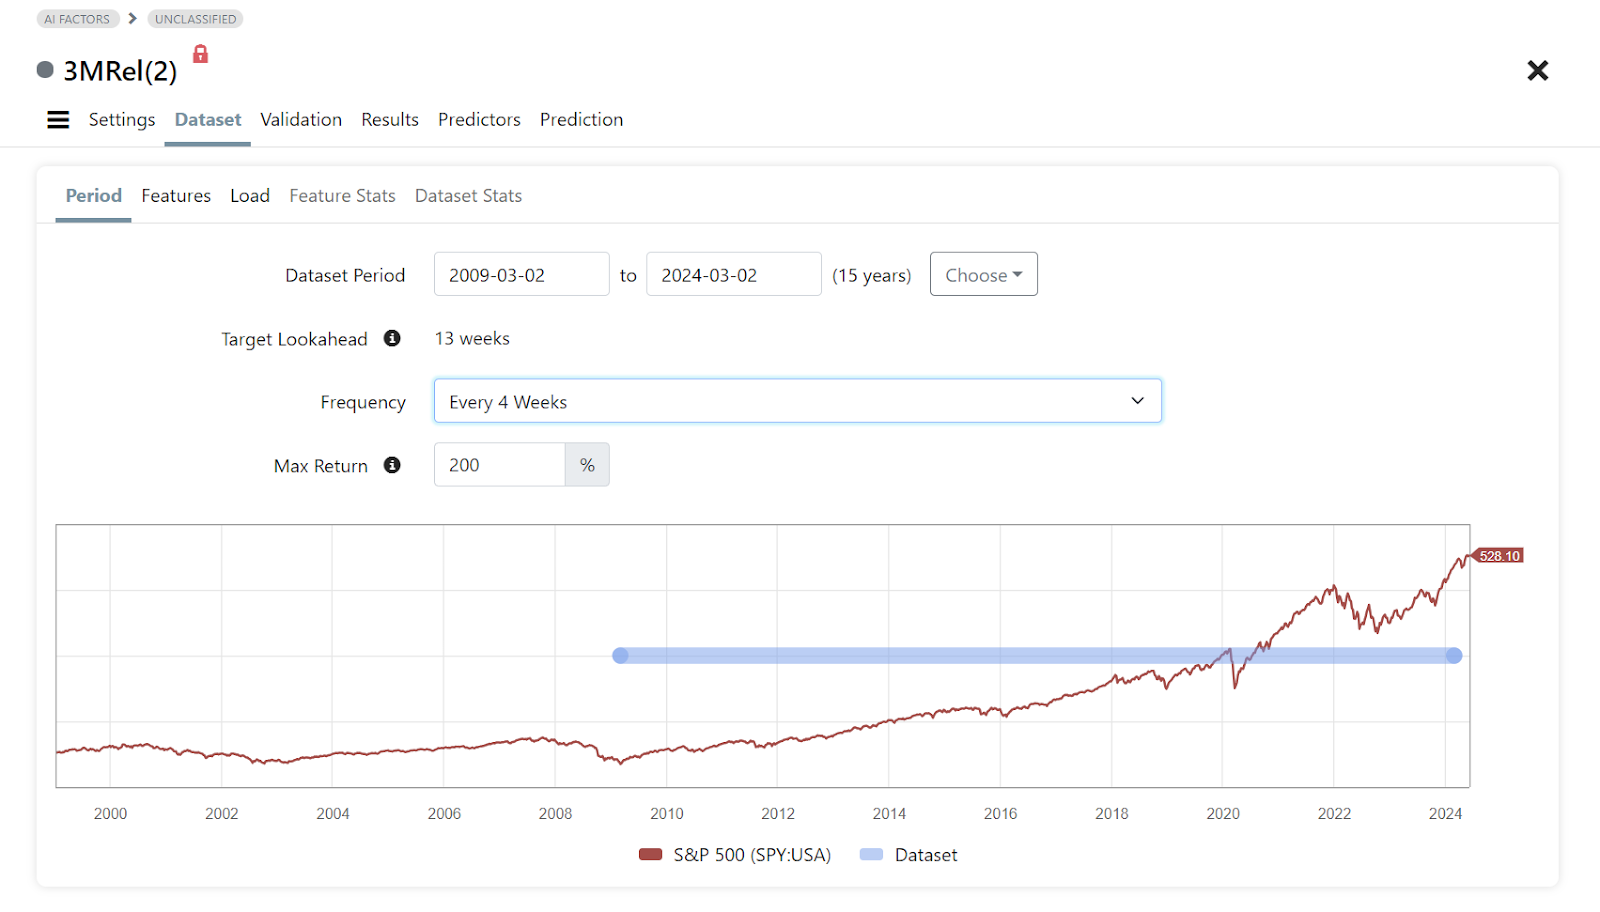
The end date of your dataset period is limited by the target lookahead, which is the period that has to be excluded because the selected target will require future data beyond the dataset end date.
To create an AI Factor, you’ll need features on which to train the model. Features are the input variables a machine learning model uses to predict a target variable. They can be financial ratios, technical indicators, macro data, or other relevant data that may influence the target variable.
Example with a small set of Features

Portfolio123 provides the flexibility to import features from existing ranking systems, from other AI Factors or from Factor Lists. This allows you to leverage previously developed ranking systems or AI Factors as inputs for your new model. Please note that only factors and functions will be imported, not preferences about higher or lower rank preferences or rank against industry.
When selecting features, it is important to choose relevant and informative variables, as this will directly impact the accuracy and reliability of your model. Avoiding highly correlated features can also be beneficial, as they may lead to multicollinearity issues and reduce the model's performance.
Once your dataset is ready, you can review the aggregate statistics and load it.
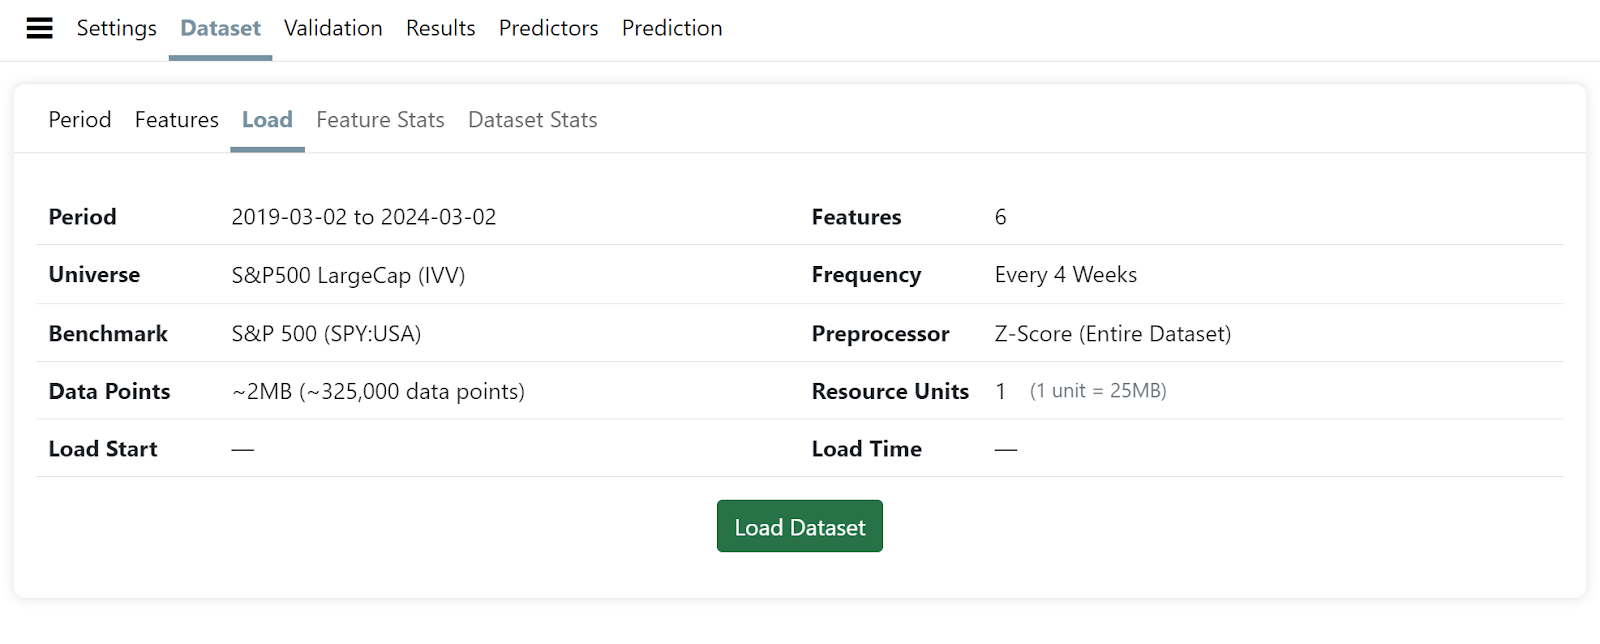
Also pay attention to the number of NAs for the entire dataset and each feature. Consider removing any features with a high NA%. If the Max NA% value is much higher than the NA% for a feature then it might be a case where the feature had sparse data in the early years of the period you have selected. For example, data related to earnings estimates is very limited prior to March 2002. If you attempt to create an AI Factor with estimate related factors using a start date prior to 2002 you will get an error because no stocks have data for the feature.

3. Training and Validation
Training a machine learning model involves teaching the algorithm to recognize patterns and relationships in a dataset. This is done using a portion of the dataset called the validation training set. During the training phase, the model learns by adjusting its parameters to minimize the error between its predictions and the actual outcomes. The goal is to develop a model that can make accurate predictions on new data. The training period is the duration of historical data used to train the model.
Validation evaluates the model's performance on a separate portion of the dataset called the validation holdout set. This set is not used during training but allows for assessing how well the model performs using new data.
A Gap period is excluded between training and validation to avoid data leakage between the two partitions of the dataset.
 Validation Methods
There are different techniques to split and use the data for validation:
Basic Holdout: Splitting the data into a training set and a single validation set.
Time Series Cross-Validation: This involves multiple validation periods, with different models trained on expanding training sets which have the same start date. This ensures that temporal order is respected by training on past data and validating future data while being more robust.
Rolling Time Series CV: same as time series validation, but training period length is kept fixed while the start date is moved forward in each fold vs the prior fold.
K-fold CV (Blocked): Dividing the data into 'k' blocks and validating across each block in turn. This maximizes utilization of training data, although temporal order is not respected.
 Validation Models
Multiple models are selected and validated in an effort to find the model which produces the best results with your feature set. You can choose between different implementations of our machine learning algorithms or create a copy and customize the hyperparameters within allowed bounds. More information on the available algorithms is available here.
XGBoost: XGBoost (eXtreme Gradient Boosting) is a popular implementation of gradient boosting machines. It's an ensemble learning technique that builds multiple decision trees sequentially, with each new tree focusing on correcting the errors of its predecessor, leading to good accuracy and predictive performance.
Neural Networks (Keras): Neural networks are machine learning models inspired by the human brain's structure and function. They consist of interconnected layers of artificial neurons, enabling them to learn complex, non-linear relationships in the data. Keras is a high-level deep learning library that simplifies the creation, training, and deployment of neural networks.
Neural Networks (DeepTables): machine learning models designed specifically for tabular data. Inspired by the architecture of neural networks, DeepTables consist of multiple layers that can effectively capture both linear and non-linear relationships within complex datasets. The DeepTables framework integrates deep learning techniques with traditional machine learning methods, optimizing performance for structured data.
Random Forest: Random Forest is an ensemble learning algorithm that constructs multiple decision trees and combines their predictions to improve accuracy and reduce overfitting. Introducing randomness in feature selection and data bootstrapping creates diverse trees that together provide more robust and reliable predictions.
Extra Trees: Extra trees are a type of decision tree machine learning model that learns to make decisions based on hierarchical, tree-like structures. They recursively split the dataset into subsets based on feature values, ultimately leading to a decision at the leaf nodes. Decision trees are simple, interpretable, and can handle categorical and numerical data.
Support Vector Machines: Support Vector Machines (SVMs) are a class of supervised learning algorithms used for classification and regression tasks. They aim to find the optimal hyperplane that best separates the classes or predicts the target value while maximizing the margin between the hyperplane and the nearest data points (support vectors).
Generalized Additive Models (GAMs): GAMs are a flexible class of regression models that combine the strengths of linear regression with the ability to capture non-linear relationships in the data. They model the relationship between the target variable and the predictors as the sum of smooth functions, enabling them to adapt to complex patterns.
Linear Regression: Linear Regression is a fundamental statistical and machine-learning technique that models the relationship between a target variable and one or more predictors as a linear function. It aims to find the best-fitting line that minimizes the sum of the squared differences between the observed and predicted values, making it simple, interpretable, and widely applicable.
Creating custom models
Hyperparameters can often be tuned to produce better results for a given Feature set. To create a copy of a model and customize the hyperparameters, click the Add Model(s) button on the Validation, Models page. Locate the model you want to copy then click on the 'three dots' next to the model name and click Copy. Edit the hyperparameters, save, then run the validation. Repeat these steps for each hyperparameter combination you wish to test.

Grid Search
Manually creating and testing a large number of hyperparameter combinations can be tedious. The Grid tool can be used to generate a matrix of hyperparameter combinations.
Grid search is a hyperparameter tuning technique in machine learning used to systematically search for the best combination of hyperparameters for a given model. By defining a grid of potential hyperparameter values, grid search evaluates the model's performance for each combination through an exhaustive search. This is typically combined with cross-validation to ensure the selected parameters generalize well to unseen data. While computationally intensive, grid search is a straightforward and effective method for optimizing model performance, as it ensures all possible combinations within the defined grid are tested.
To add the models from a predefined P123 grid, click the Add Grid button on the Validation, Models page then choose a grid and click Add Grid. Then run validation for each model.
If you prefer to create a custom grid, you can either copy and then modify one of the P123 grids or create your own grid from scratch. To copy a grid, click on the 3 dots next to the grid name, choose Copy, make your changes and Save.
To create a custom grid from scratch, click 'Add Grid' then click 'New Grid' to open the New Grid page. The text entered in the Prefix field will be the prefix used in the name of the models created by the grid. The Main hyperparameter reference lists the available hyperparameters. Click on each hyperparameter to see the default value, valid values and other information. Each hyperparameter can be added to either the 'Common hyperparameters' section or the 'Variable hyperparameters' section. Common hyperparameters are those where only a single setting is desired and variable hyperparameters are those where you want to test multiple settings.
To add a hyperparameter, click on it and then click the 'Add Selected' button in the section where you want to add the hyperparameter. When adding the hyperparameter values, you can manually enter them or use the Increment field to automatically calculate values based on the Start, Max and Increment settings. The final setting determines if it will increment by a set amount or by a percentage.
Example: Increment the value by 10
Grid page after hyperparameters have been added:
Clicking 'Save' returns you to the Add Grid page. Choose the grid and click 'Add Grid' to add all the models generated from the grid to your AI Factor. The example above created 120 models which now need to be validated.
Validating Models
Training models can be very intensive computationally and you’ll have to choose between different machines when training. You will be charged based on the time utilized for training and the price per hour depends on the power of the machine you selected. More intensive models can take hours on slower machines, and depending on the type of algorithm, training can require different hardware (CPU vs GPUs for example). On Portfolio123 it is easy to select your preference (performance or lower cost) and the system will automatically make the selection of CPU vs GPU. Depending on current usage, your requests might be temporarily queued depending on server demand.
Some of the Portfolio123 models have tags which are helpful when selecting a machine to use.
#singlethreaded or #multithreaded: If multithreaded, the model can utilize multiple CPUs so selecting a machine that has a higher number of CPUs will result in the validation taking less time.
#highmem: The model requires a large amount of memory. If you select a machine which has insufficient memory then there is a good chance the validation will eventually fail and notify you that more memory was required.

Enable the 'Save Validation Predictions' option to save predictions from the trained validation model(s). You will be able to download these predictions or use them in backtests. Please note that models that save prediction data use more Resource Units.
See the 'Creating and using Predictors' section below for information regarding when to use the AIFactorValidation() function vs the AIFactor() function.
To run a Screen backtest using saved validation predictions, click the 'fx' button on the Validation, Models page after training completes. The prepopulated AIFactorValidation() function call will be displayed in the popup in red text and can be copied and used to access validation predictions in ranking system formulas and buy/sell rules in the backtests of your Screens or Simulated Strategies.
To use AIFactorValidation() in a Ranking system, simply add a Stock Formula and use the AIFactorValidation() function as the Formula. You can use multiple AIFactorValidation() functions in a ranking system or combine AIFactorValidation() with other typical ranking system rules.

There are some limitations to be aware of when using AIFactorValidation(). In order to use validation predictions in backtests, the universe must match the universe used in the AI Factor and the backtest rebalance dates must exist in the validation data. This means that the frequency setting used in the backtest must match the frequency setting in the AI Factor dataset.
4. Evaluating Your AI Factor
To assess the performance of your AI Factor, you can use various evaluation methods, including:
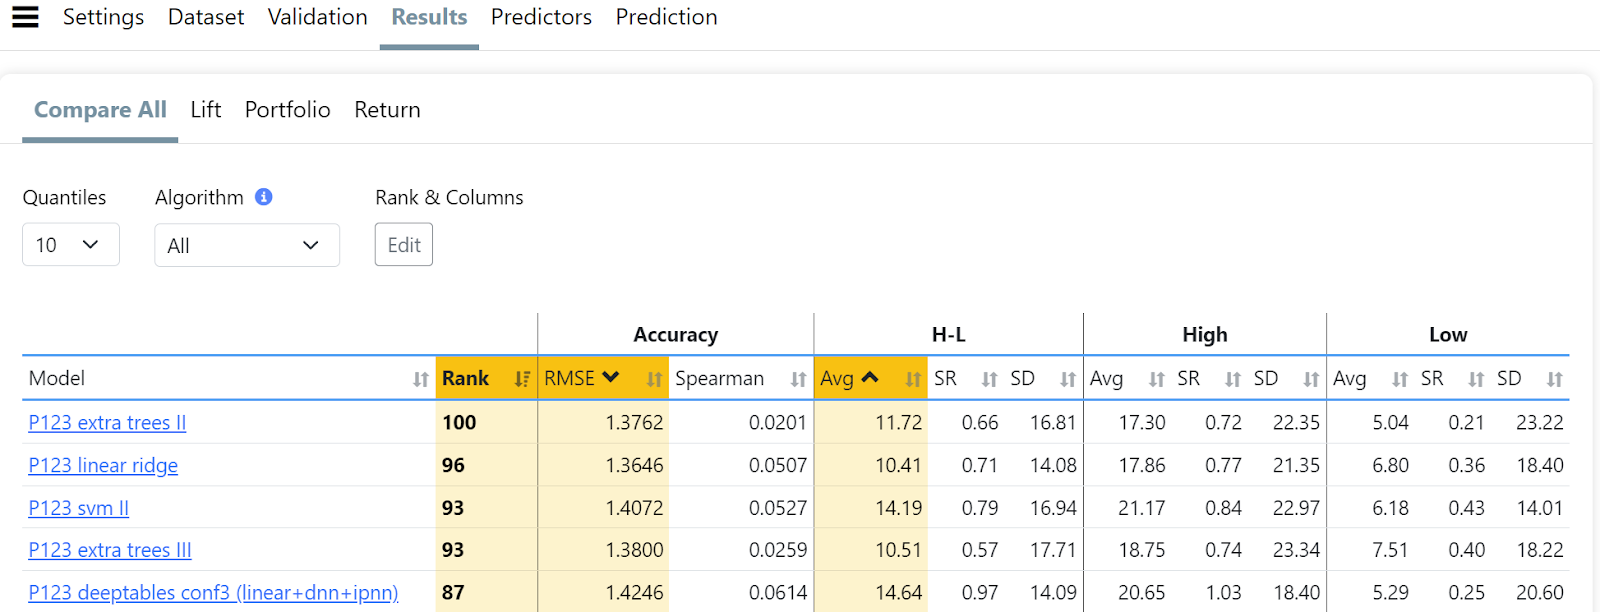
Compare all: This table compares different models using metrics like RMSE, Spearman's rank, or raw portfolio performance to help identify the best performers. Click the Edit button under Rank & Columns to specify which stats you want to use in the calculation of the Model's rank. Also notice that there is a Quantiles setting that determines the number of buckets the stocks are divided into. This setting in important because some of the stats displayed on this page are for only the bottom and top buckets so of course the number of stocks in those buckets will affect those stats.
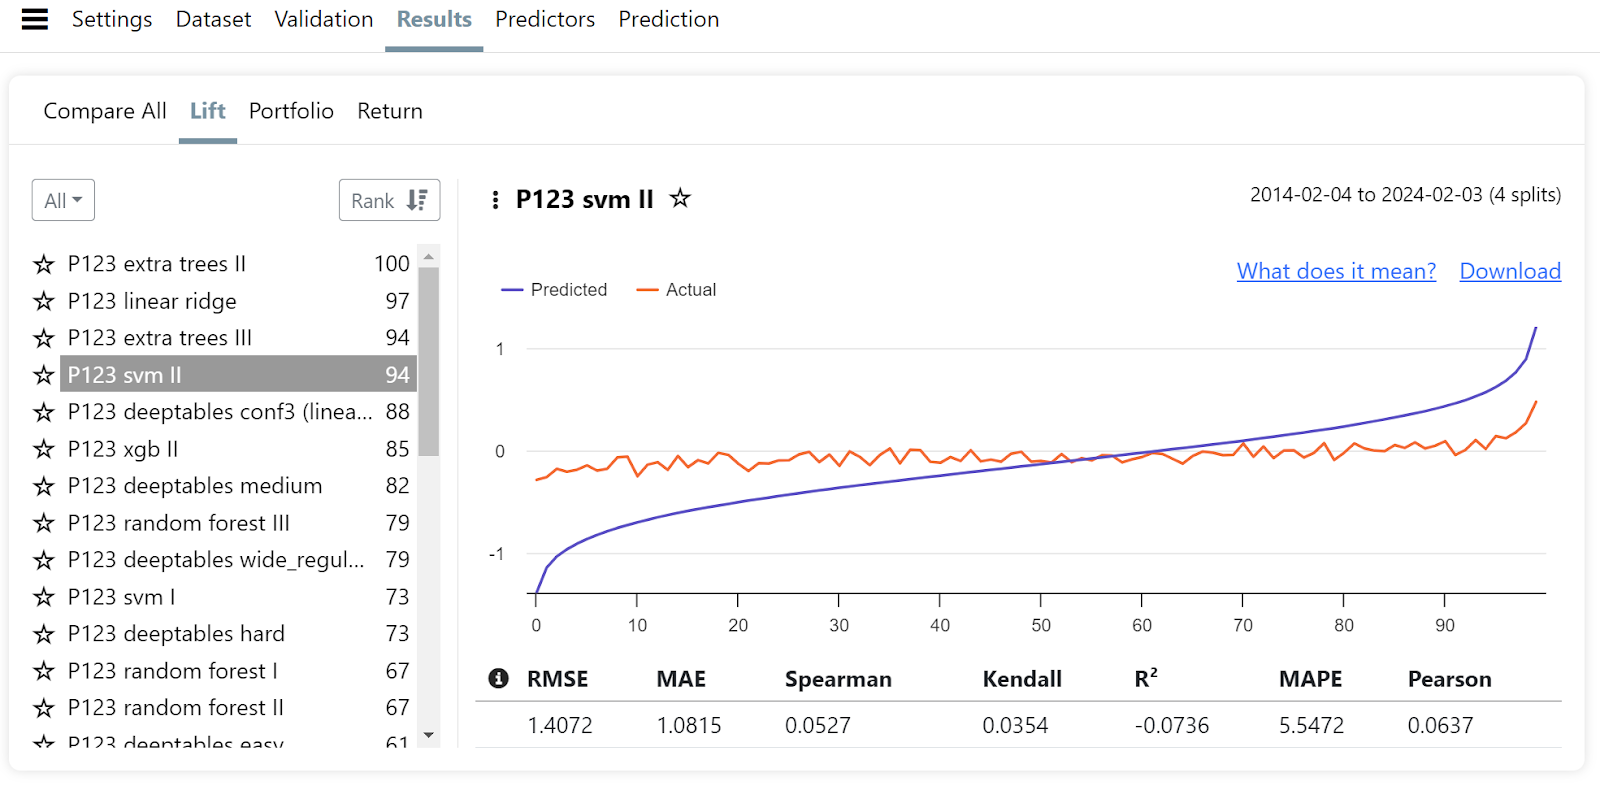
Lift Chart: A lift chart compares the predicted performance of your AI Factor to the actual outcomes using the model's predictions against the data from the holdout period.
Portfolio: This tool compares the cumulative returns of top and bottom quantiles for different models, visualizing their performance over time. The Period and Excess Returns section analyzes returns and excess returns over validation periods.
Returns: Displays annualized Returns by Quantile with options to display either excess return or total return. Also contains various stats related to the top and bottom buckets as well as stats for the average returns of the entire bucketized series.
Compare all
Lift chart
Portfolio

Returns

5. Creating and using Predictors
Once satisfied with the performance, you can train a Predictor based on one of your trained models to use your AI Factors anywhere in Portfolio123. Depending on your use case, you can train the predictor using all available historical data (for example, if you plan to launch a Live Strategy based on it) or leave out a holdout period to backtest in a simulation. Once your strategy has been live for a certain length of time, you would want to retrain it to include all data that became available since you initially trained your prediction.
You can use the AIFactor() function everywhere in Portfolio123, for example, in a ranking system, a screen rule or a buy rule in a live strategy. Engine requests will run more slowly when requesting predictions from an AI Factor, and backtests can take several minutes. AIFactor() is an expensive, slow running operation since it involves sending the dataset for the chosen universe to the AI backend, normalizing the data and calculating the predictions. For this reason, in backtests it can only be used up to 5 years in the past. Please train a Validation model and use the AIFactorValidation() function instead of AiFactor() when longer backtests are required. AIFactorValidation() runs much faster because it uses predictions which were calculated and stored during the validation process while AiFactor() calculates the predictions in real time.
On the Predictors page, you will see an 'fx' button next to the name of the predictor after the predictor has been trained. Clicking this button will pop up a dialog with additional information including the pre-filled AIFactor() formula which can be used in ranking system formulas and buy/sell rules. For example, the popup contained AIFactor("Russell2000 3mRel", "xgb II") which could then be copied and pasted into the Formula field of a Stock Formula in a ranking system. This could be the only rule in the ranking system or there could be other additional rules including additional AI Factors.

In the example below it is used as a rule in the Screener to backtest a portfolio containing the top 10% of stocks based on an AI Factor by using the AIFactor function inside the FRank function. Notice what appear to be single quotes around the AIFactor function. Those are actually backtick characters which are usually found below the ~ on your keyboard. This is standard Portfolio123 syntax any time the formula would contain quotes nested inside other quotes.
FRank(`AIFactor("Russell2000 3mRel", "xgb II")`) > 90

Backtests with AI Factors are only valid if the start date of the backtest period is later than the end date of the predictor training period plus a gap to prevent any data leakage. The algorithms are trained to be highly effective during the training period and if they have 'seen' any of the data in the backtest period then they will be able to produce unrealistic results. Another option is to use an entirely different universe in your backtest, but only if you do not have any features that would overlap the original universe like industry level features, macro features, etc.
6. Conclusion
Portfolio123 AI Factors utilizes powerful machine learning algorithms to find the optimal combinations from your long list of fundamental and technical factors. Something that is not possible to do manually regardless of how much time you were to spend.
AI Factors you create can then be used to create new investing strategies or to enhance your current strategies. AI Factors also offers diversification from your current investing strategies which were probably created using your knowledge of a small set of factors.