Overview
The Stock Compare tool allows you to quickly compare key metrics for a list of stocks. The list of stocks can be created by typing the tickers, or based on the industry/subindustry of a ticker, or based on a list from a strategy, screen, or watchlist. Up to 50 stocks can be compared depending on your subscription level.
Accessing Stock Compare
The Stock Compare tool can be accessed several ways:
From the Main menu – Choose Data, Compare Stocks & ETFs.
In the Manage section from a Strategy or Watchlist – Click on the hamburger menu (symbol with 3 horizontal lines) then click Compare All. The Stock Compare tool will be loaded with the list of stocks from your Strategy or Watchlist.
Screener and Universe page – Click the COMPARE button on the right side of the page above the screen results. The Stock Compare tool will be loaded with the list of stocks from your Screen or Universe.
From the Data pages (Timeline, Snapshot, etc.) - Click on the hamburger menu then on Compare.
Reference Stock
Stock Compare has the concept of a ‘reference stock’. The purpose of the reference stock is to use it in some of the scoring options where the metrics from the other stocks will be compared to those of the reference stock.
If you used the “similar stocks in industry/subindustry” option to do the stock compare, then the reference stock will be automatically set to the ticker you entered on that page.
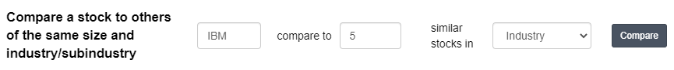
IBM was used above, so when the Stock Compare page opens, IBM will be on the left side and that column is shaded yellow to indicate that IBM is the reference stock.
If you opened stock compare some other way, from a Watchlist for example, then there will not be a reference stock selected. If you want to add one, type the ticker in the Reference Stock field at the top center of the page:

Reports
There are several pre-defined reports available or you can design your own custom reports. To create a new report from the Stock Compare page, click on the hamburger menu in the top left corner and select New Report. This Report Editor page allows you to create multiple Groups and add metrics to each Group. Using this page should be intuitive. The scoring methods will be explained in the next section.
Various Ways to Score
Stock compare has the option of scoring each metric in the report. The individual metric scores are then totaled at the bottom of the report and the stocks with the highest scores are on the left side.
There are 6 types of scoring available in the Stock Compare Reports.
No Rank - metric is displayed in the report, but is not scored.
Highest/Lowest - Highest/Lowest stock gets the Score value added to its total score.
Example: For metric Dividend Yield, choose Highest and Score=1. Result is that the one stock with the highest Yield will get 1 point added to its total score on the Stock Compare screen.
Higher is Better/Lower is Better - The stocks are ranked and their rank is added to their total score. Any with an NA for the metric get a score of 0.
Example: For metric ROE TTM, compare 20 stocks and choose Higher is Better. Result is that the stocks are ranked and the one with the highest ROE gets a score of 20. The next highest ROE gets a score of 19, and so on.
Multiple Highest/Multiple Lowest - The top/bottom x number of stocks get the Score value added to their total score. The value of x is set to the Count value specified.
Example: For metric Sales Growth TTM, choose Multiple Highest, Count=3 and Score = 2. Result is that the 3 stocks with the highest Sales Growth TTM will get 2 points added to their total score.
Value Greater Than/Value Less Than - Any stock where the metrics value is greater than/less than the Value specified will have the Score value added to their total score.
Example: For metric Price/Earnings, choose Value Less Than, Value=20 and Score = 1. Result is that any stock with a PE < 20 will get 1 point added to their total score.
Value Greater Than Reference Stock/Value Less Than Reference Stock - all stocks with a metric value that is greater than/less than the metric of the Reference stock will have the Score value added to their total score.
Example: For metric EPS Growth TTM, choose Value Greater Than Reference Stock and Score = 5. Result is that any stock with an EPS Growth TTM that is greater than the EPS Growth TTM of the Reference stock will get 5 points added to their total score.
Also, you can combine several scoring options for the same metric. For example, you can have all 3 of these rules in the same report:
Rule 1: EPS Growth TTM, Multiple Highest, Count = 5, Score = 3
Rule 2: EPS Growth TTM, Multiple Lowest, Count = 5, Score = -4
Rule 3: EPS Growth TTM, Value Greater than Reference Stock, Score = 2
If you were comparing 20 stocks, the results would be:
The 5 with the highest EPS Growth get 3 points added to their score.
The 5 with the lowest EPS Growth get 4 points subtracted from their score
Any stock where the EPS Growth is higher than that of the Reference stock gets 2 points added to their score.
However, you would not want to combine Higher is Better/Lower is Better scoring with the other types of scoring because with this scoring method, the maximum score varies based on the number of stocks being compared since this scoring method ranks the stocks.
Use cases
Use Case 1 – Looking for Investment Ideas
As an example, assume you were interested in semiconductor manufacturing stocks and you were looking for investment ideas. Create a simple screen to get a list of semiconductor manufacturing companies using these rules:
Industry = SEMIMFR
AvgDailyTot(50) >= 50000
Between(mktcap,50,2000)
Save the screen if you want to come back to it later. Run the screen then click on the COMPARE button. The Stock Compare page is displayed. Use the various reports to see how the stocks stack up against the others in the list. When you find a stock that you are not interested in, click on the ‘X’ next to the ticker to remove it from the list. Repeat until you have a short list of stocks to research further. You can click on the Actions button on the right side of the screen to export your report to a csv file.
Use Case 2 - Review when considering buying a stock
If you were interested in buying MSFT, you could compare MSFT to the other stocks in the same Industry by opening Stock Compare and selecting this option:

The list of stocks will be the 25 which are in the same industry and have a market cap that is closest to MSFT.
Select the desired report when the Stock Compare page opens. Then click the Flip Vertical button. Orientating the data vertically makes it easier to review each metric in the report.
Use Case 3 – See if a scoring system worked in the past
You have created a report with a scoring system and you want to see what the results would have been if you used it to pick one of the tech titans last year.
Do a new Stock Compare for the tickers in the test:

Go to the report that you want to test. Edit the report and create a new group at the top called ‘Future Returns’ and select the ‘Future 1yr Tot Return’ factor. Save the report. On the Stock Compare page, change the Report Date to last year’s date. The screen will now show the stock’s scores as they were a year ago and the ‘Future 1yr Tot Return’ field will show the returns of those stocks over the following year. The results below are from the Core Combination report with a Report Date of 5/1/2020:
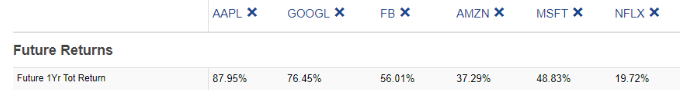
The two stocks with the highest returns in the last year were AAPL and GOOGL. Those are the two that had the highest scores in the scoring report that was used in the test with last year’s date. So, in this case, the scoring did an excellent job of picking the best stocks from that group.
Use Case 4 – Compare the fundamentals today to a point in the past
AMZN was a pretty average stock until around January 2009. What did the metrics for AMZN look like just before the huge gains compared to today? To get insight into this, do a Stock Compare for AMZN:

Then enter AMZN as the Reference Stock on the Stock Compare page. You will now have two columns for AMZN. Change the As Of Date for the Reference Stock to 1/3/2009:

Now the metrics in the Reference Stock column are from 1/3/09 while the metrics in the other column are from today, or whatever date you have selected in the Report Date field, and you can compare them using any of the reports. You could also enter additional tickers to see if their current fundamentals are similar to those of AMZN back on 1/3/09.